Introduction
“I am aware that people are disappointed with the performance. But all of our measurements are in the green, so the problem must be somewhere else.”
Wouldn’t it be nice to be able to quickly reply to a phrase like the one above when there are numerous slowdowns in your environment? With a solid database monitoring system, DBAs don’t have to deal with continual fires and can have answers ready when something goes wrong. Because they have ready-made monitoring processes for determining root causes. This article provides an overview of the traceability challenge in the ClickHouse database in order to reach root causes more easily.

Consider all the moving pieces between your users and your databases, such as the application, the operating system, virtualization, storage, hardware, and the network. As a result, determining the source of application performance issues is not always simple. Because the database is one of those moving pieces, it gets scrutinized when users complain. In a word, detailed and correct metrics are a tremendous blessing for database specialists in particular, and OpenTelemetry makes these metrics available.
What is OpenTelemetry?
OpenTelemetry, abbreviated OTel, is a vendor-independent open source Observability framework for instrumenting, generating, collecting, and exporting telemetry data such as logs, metrics, and traces. OTel, a Cloud Native Computing Foundation (CNCF) incubation project, intends to provide homogeneous sets of vendor-agnostic libraries and APIs – primarily for data collection and transfer. OTel is quickly becoming the global standard for creating and handling telemetry data and is widely used.
Before diving into OpenTelemetry, it’s vital to understand fundamental concepts like spans and traces. What about logs, though? What role do these play? What about events? Another goal of this blog article is to educate you on the differences between logs, events, spans, and traces so you can begin exploring OpenTelemetry.
Logs are human-readable flat text files that engineers use to collect relevant data. Messages in logs occur at a particular point in time (though not necessarily at every point in time). Unfortunately, log formats are not standardized across languages or frameworks, making them difficult to understand and retrieve. It is also difficult to aggregate relevant logs together.
![]()
Events are structured logs. They use a standard format (JSON) and are much easier to query.
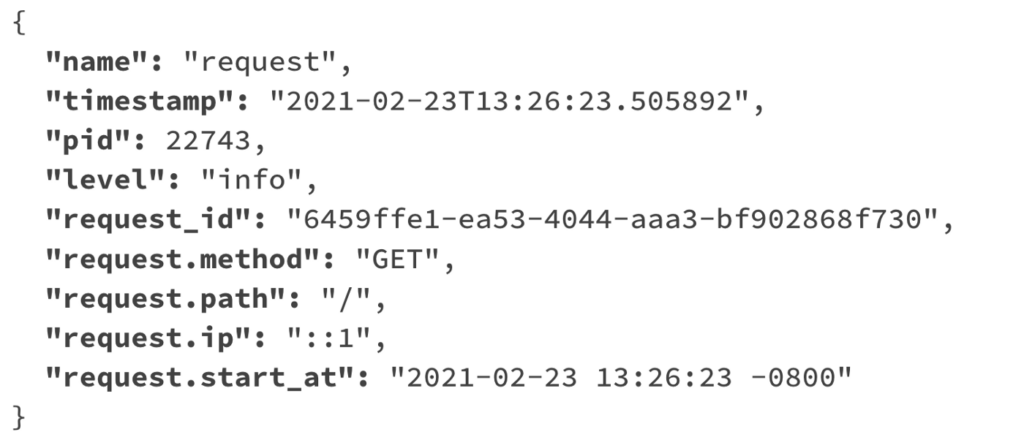
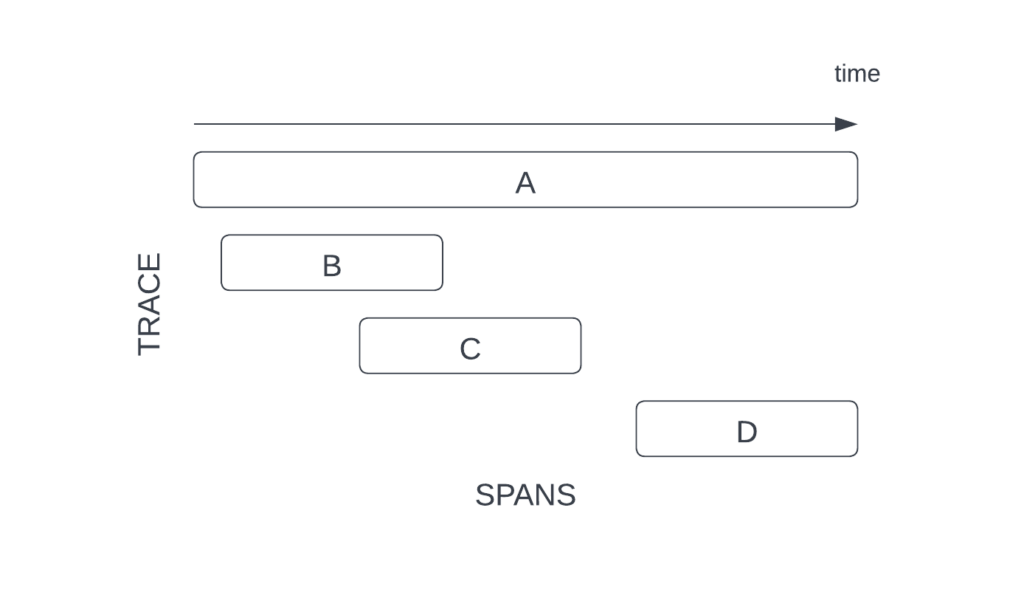
Span presents a unit of work. They can be thought of as the work done during the execution of an operation.
Logs are records of events that occurred at a certain point in time. Other than being easier to read and query, events aren’t any more useful. The issue is that events, on their own, do not provide a complete tale. What if we instead captured data for a specific period of time (i.e. a time span)?
Assume the following scenario:

We used to have logs that looked something like this:
![]()
We have a span that looks something like this:

A disappointment with this information? It would be bad if you only had those three fields. We require some extra information in order for the span to be more useful to us. In OpenTelemetry, we may include metadata such as Operation name, start timestamp, end timestamp, duration, parent ID, attributes, and so on in our spans.
Traces are also referred to as distributed traces. They cover network, process, and security boundaries to view your system comprehensively. A span is the fundamental component of a trace. A trace is a tree of spans that begins with a root span and encapsulates the end-to-end time required to complete a task.
Tracing the ClickHouse Itself
Simply, trace spans are generated by ClickHouse for each query and for specific query execution stages such as query planning and distributed queries. The database stores OpenTelemetry trace span information under the system database. To be meaningful with this tracing, data must be transferred to a monitoring system that supports OpenTelemetry, such as Jaeger, Prometheus. Each tool can show advantages and disadvantages when compared to the other.
To trace the ClickHouse database, you can setup a materialized view to export spans from the system.opentelemetry_span_log table:
CREATE MATERIALIZED VIEW default.zipkin_spans
ENGINE = URL('http://127.0.0.1:9411/api/v2/spans', 'JSONEachRow')
SETTINGS output_format_json_named_tuples_as_objects = 1,
    output_format_json_array_of_rows = 1 AS
SELECT
    lower(hex(trace_id)) AS traceId,
    case when parent_span_id = 0 then '' else lower(hex(parent_span_id)) end AS parentId,
    lower(hex(span_id)) AS id,
    operation_name AS name,
    start_time_us AS timestamp,
    finish_time_us - start_time_us AS duration,
    cast(tuple('clickhouse'), 'Tuple(serviceName text)') AS localEndpoint,
    cast(tuple(
        attribute.values[indexOf(attribute.names, 'db.statement')]),
        'Tuple("db.statement" text)') AS tags
FROM system.opentelemetry_span_log
Behold a trace span result:
SELECT * FROM system.opentelemetry_span_log LIMIT 1 FORMAT Vertical;
──────
trace_id:         cdab0847-0d62-61d5-4d38-dd65b19a1914
span_id:          701487461015578150
parent_span_id:   2991972114672045096
operation_name:   DB::Block DB::InterpreterSelectQuery::getSampleBlockImpl()
start_time_us:    1612374594529090
finish_time_us:   1612374594529108
finish_date:      2021-02-03
attribute.names:  []
attribute.values: []
Also, tracking many services is possible
Along with tracing the ClickHouse database only, many services in a distributed system may be involved in providing a response to a single request. It is critical that the course of such a request may be followed across all connected services, not just for debugging purposes. This article provides an overview of the traceability challenge in distributed systems and a comprehensive approach to tracing with OpenTelemetry. SigNoz or Uptrace are useful tools for this purpose, and they store the contents in the ClickHouse database. At this point, we will configure the SigNoz platform step by step. We can observe that OTel collectors collect data from containers and write it to the ClickHouse database at the end.
First, let’s clone the SigNoz application to our local with the git clone command.
git clone -b main https://github.com/SigNoz/signoz.git
Let’s go to the deploy folder with the cd command.
cd signoz/deploy/
Let’s get the platform ready for use using the docker-compose.yml file.
docker-compose -f docker/clickhouse-setup/docker-compose.yaml up -d
Let’s check that all systems are up with the docker ps command. There should be 8 up containers in total.
➜  deploy git:(main) docker ps
CONTAINER ID   IMAGE                                          COMMAND                  CREATED              STATUS                        PORTS                              NAMES
849300f856c5   signoz/frontend:0.11.2                         "nginx -g 'daemon of…"   About a minute ago   Up 8 seconds                  80/tcp, 0.0.0.0:3301->3301/tcp     frontend
5ef6c4cba70f   signoz/alertmanager:0.23.0-0.2                 "/bin/alertmanager -…"   About a minute ago   Up 8 seconds                  9093/tcp                           clickhouse-setup-alertmanager-1
1d2224707f12   signoz/query-service:0.11.2                    "./query-service -co…"   About a minute ago   Up 39 seconds (healthy)       8080/tcp                           query-service
2d8d1a7cba63   signoz/signoz-otel-collector:0.55.3            "/signoz-collector -…"   About a minute ago   Up 39 seconds                 0.0.0.0:4317-4318->4317-4318/tcp   clickhouse-setup-otel-collector-1
6d16948e12dd   signoz/signoz-otel-collector:0.55.3            "/signoz-collector -…"   About a minute ago   Up 39 seconds                 4317-4318/tcp                      clickhouse-setup-otel-collector-metrics-1
4ab0fc0d6527   clickhouse/clickhouse-server:22.4.5-alpine     "/entrypoint.sh"         About a minute ago   Up About a minute (healthy)   8123/tcp, 9000/tcp, 9009/tcp       clickhouse-setup-clickhouse-1
59a06341fd31   grubykarol/locust:1.2.3-python3.9-alpine3.12   "/docker-entrypoint.…"   About a minute ago   Up About a minute             5557-5558/tcp, 8089/tcp            load-hotrod
d49911914ca5   jaegertracing/example-hotrod:1.30              "/go/bin/hotrod-linu…"   About a minute ago   Up About a minute             8080-8083/tcp                      hotrod
We can access the panel by going to http://localhost:3301
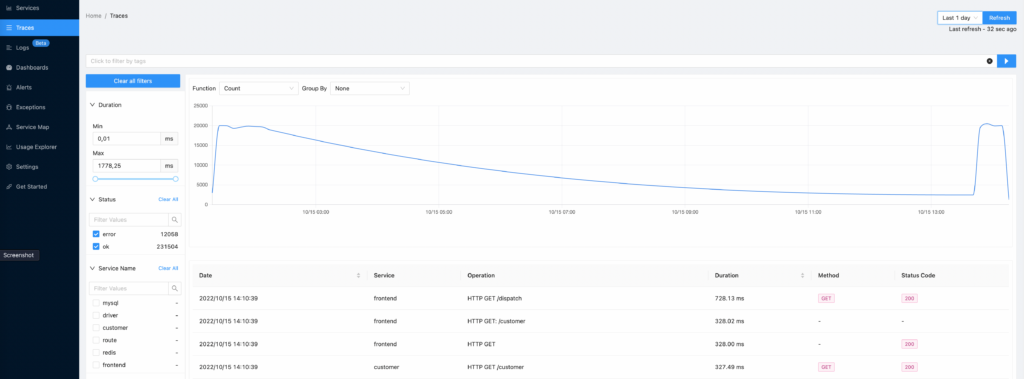
Another example of content:
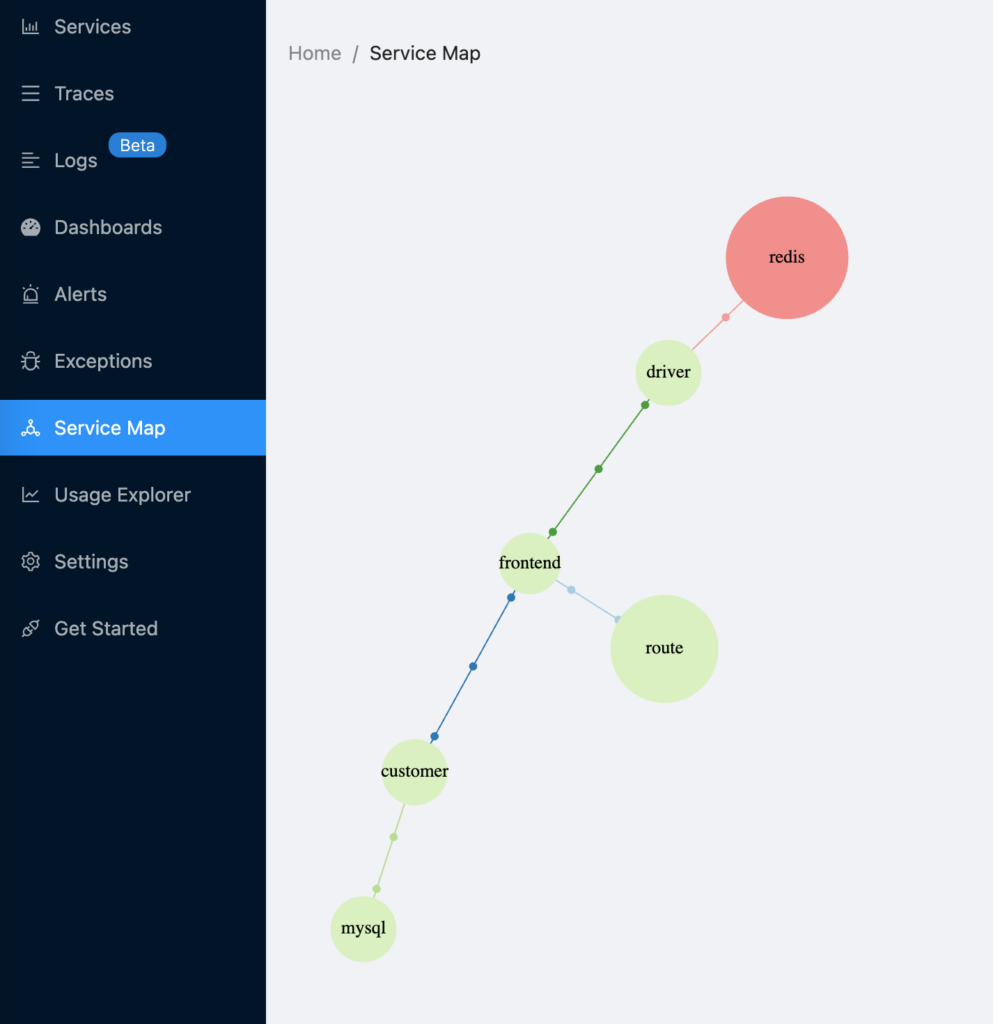
Using the OpenTelemetry.NET client libraries, you can generate logs, metrics, and traces. The acquired telemetry data can then be stored and visualized using an open-source APM tool such as SigNoz. We can also access OTel’s contents in detail by connecting with the ClickHouse database. As a result, the entire distributed system is under control.
4ab0fc0d6527 :) SHOW DATABASES;
──────
┌─name───────────────┐
│ INFORMATION_SCHEMA │
│ default            │
│ information_schema │
│ signoz_logs        │
│ signoz_metrics     │
│ signoz_traces      │
│ system             │
└────────────────────┘
Conclusion
When you see a continuous rise in CPU, it’s easy to worry and go into firefighting mode, but is the CPU busier just because the server is busier? Is the number of connections or user requests per second higher than usual? With OpenTelemetry features, a monitoring database, and distribution systems, teams can keep track of all their servers in one place. They can quickly track, locate, and resolve slow-running queries and analyze other root causes of issues that may impair server health and performance.
To read more on Monitoring in ClickHouse, do consider reading the below articles
- ClickHouse Monitoring: Analysing ClickHouse Performance with strace
- ClickHouse Monitoring: Tracking Key Activities by ClickHouse Users
- ClickHouse Monitoring: Configuring ClickHouse Server Logs in JSON Format
References: